The stock market moved 1.8 percent lower on Wednesday morning. By afternoon it had recovered 1.6 percent. Two different explanations appeared on the same financial news programme within three hours, each contradicting the other, both applied to the same session on the same index.
That is a standard mid-2026 trading day. Persistent inflation above 4 percent, a Federal Reserve holding rates restrictive without offering a timeline for relief, and extreme index concentration in a handful of AI infrastructure giants have widened the gap between what daily headlines describe and what markets are actually doing.
Reading the stock market today requires ignoring most of what is written about it. What follows is the framework institutional desks use instead.
Mid-2026 Market Reality: Key Indicators
Understanding Stock Market Movements Beyond the Headlines
Why “Stock Market Today” Headlines Are Often Misleading
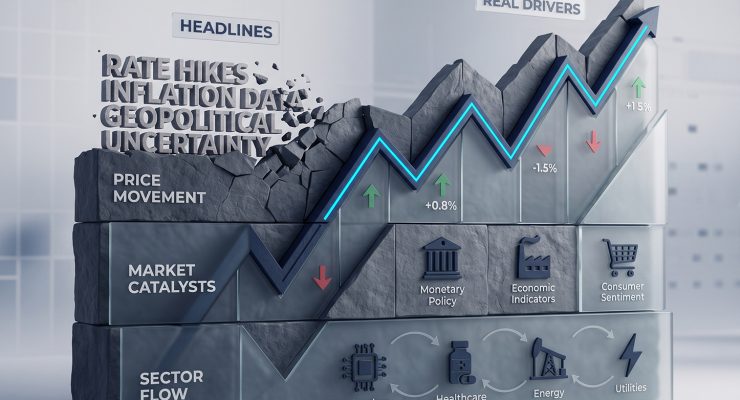
Financial headlines prioritise clicks over accuracy. A complex, multi-variable market session gets attributed to a single data point, stripping out the overlapping institutional positioning, options mechanics, and currency flows that jointly produced the outcome. The explanation arrives after the fact, fitted to the price rather than derived from it. Midday reversals routinely generate two contradictory headlines within the same news cycle, with each treated as definitive analysis.
The Difference Between Price Movement and Market Narrative
Price is data; narrative is interpretation built around data. The same jobs report can be framed as “resilient economy” by one outlet and “Fed will hold rates longer” by another, with each framing supporting the opposite trade recommendation. Both appear the same morning. Neither is the price itself, which reflects millions of simultaneous transactions reaching a single clearing point through a process no single narrative captures.
What Really Drives Daily Market Action
Three forces dominate intraday price discovery: institutional block trades executed by multi-billion-dollar desks, algorithmic rebalancing triggered by volatility thresholds, and options-hedging flows that amplify moves already in progress. Retail news consumption ranks well below all three. The gap between what consensus expected and what was reported moves prices. The absolute quality of the news, whether a figure is objectively good or bad, does not.
Stock Market Index Performance Explained
What Each Major Index Represents
The S&P 500 tracks 500 large-cap American companies weighted by market capitalisation; it is the primary benchmark against which institutional performance is measured. The Nasdaq 100 concentrates on technology, software, and semiconductor companies, making it acutely sensitive to interest rate changes. The Dow Jones Industrial Average tracks 30 blue-chip companies using a price-weighted system that gives higher-priced shares disproportionate influence, making it a pulse on traditional industry rather than a genuine market proxy.
Why a Few Stocks Can Move the Entire Market
The top seven to ten stocks in the S&P 500 currently represent over 30 percent of the entire index by market capitalisation. If those names rally on earnings, the index can close positive even if 400 of the remaining 500 constituents finished the session in the red. Passive index funds reinforce this concentration by automatically purchasing the largest stocks in proportion to their weight with every new dollar of inflow, creating a self-reinforcing capital loop that benefits the already dominant.
Interpreting Mixed Index Performance
When the Nasdaq surges while the Dow declines, institutional capital is rotating out of traditional cyclical business and into high-growth technology. A flat S&P 500 paired with a surging Russell 2000 signals strong underlying domestic economic activity obscured at the large-cap level. These divergences carry more analytical information than either index read in isolation, and professionals track them before reading any market commentary.
The Real Catalysts Behind Today’s Market Moves
Economic Data Releases
With Core PCE and CPI running above 4 percent in mid-2026, every inflation print acts as the primary market-direction trigger. A hotter-than-expected reading extends rate restriction fears and sells off rate-sensitive equities; a softer reading triggers immediate rate-cut speculation and broad risk-on positioning. Non-Farm Payrolls and GDP data complete the macro picture, with markets evaluating whether the economy is sustaining a soft landing or sliding toward stagflation under the weight of sustained high rates.
Interest Rates and Federal Reserve Expectations
The Federal Reserve’s target rate is the ultimate anchor for equity valuations. Markets price not the rate itself but the probability of it changing. FOMC minutes, dot-plot revisions, and individual governor speeches are parsed at the word level for signals of a pivot or an additional tightening cycle. The question of whether Federal Reserve independence itself has become a direct portfolio risk is now a structural consideration for institutional allocation desks that had never modelled it as a variable before 2025.
Corporate Earnings and Forward Guidance
Past earnings beats matter less than forward guidance. A company reporting record quarterly profit while simultaneously lowering revenue projections for the next two quarters typically sells off sharply despite the headline number. In the current capital expenditure environment, markets actively grade management on the efficiency and return profile of AI infrastructure spending, treating capex commitments as a direct signal of competitive positioning over the subsequent 18 months.
Geopolitical Events and Market Sentiment
Energy-region conflicts generate immediate commodity price shocks that feed directly into inflation readings. Trade restrictions on advanced semiconductors trigger supply chain reassessments for entire technology sectors within hours. When geopolitical risk escalates, algorithmic asset allocation flows out of high-beta equities and into US Treasuries, gold, and the dollar within minutes of a news trigger, long before most retail investors have processed the headline.
Unexpected News and Shock Events
Flash crashes are almost always mechanical in origin. Cascading stop-loss orders and margin calls accelerate a move that began with a far smaller fundamental trigger. High-frequency trading systems withdraw buy orders during high-risk macro announcements, creating brief liquidity vacuums where prices can gap dramatically with no new fundamental information driving the movement. The VIX surge that accompanies these events is the signal, not the cause.
Sector Rotation: Where Money Is Moving Today
Defensive vs Cyclical Sectors: Key Differences
| Dimension | Defensive Sectors | Cyclical Sectors |
|---|---|---|
| Examples | Utilities, Healthcare, Staples | Industrials, Materials, Discretionary |
| Recession behaviour | Outperform, stable demand | Underperform sharply |
| Beta (vs S&P 500) | Below 1 (less volatile) | Above 1 (more volatile) |
| Dividend yield | Higher, more consistent | Lower, growth-dependent |
| Rate sensitivity | Moderate | High (earnings sensitive to growth) |
What Sector Rotation Means in Practice
Institutional managers rarely move to cash. They reposition. Capital flows from sectors with deteriorating return profiles into those with improving ones. The economic cycle framework provides the broad cadence: early expansion favours technology and consumer discretionary; late-stage slowdown shifts capital toward utilities, healthcare, and staples. Relative strength ratios between sectors reveal the direction of that flow before a single commentator articulates it.
Technology vs Energy vs Financials
Technology acts as the primary AI infrastructure growth engine while simultaneously being the sector most exposed to discount rate compression from elevated interest rates. Energy benefits structurally from every oil price surge above $90 per barrel, functioning as a built-in inflation hedge within a diversified portfolio. Financials capture higher net interest margins in elevated rate environments but face loan-default headwinds if rate pressure extends long enough to cause a credit deterioration cycle.
How Institutional Investors Drive Rotation
Quarterly rebalancing by pension funds and endowments generates predictable end-of-quarter sector flows as portfolio weights drift from their target allocations. Risk parity strategies cut exposure to high-volatility sectors mathematically as VIX readings rise. Macro-overlay desks shift entire portfolio frameworks when the inflation regime changes from “transitory” to “structural,” rotating out of rate-sensitive real estate and into energy and commodity producers.
Trading Volume and Market Participation Signals
Why Volume Confirms or Contradicts Price Moves
Volume represents financial conviction. A market rally on below-average volume signals that institutional desks are not participating, making the move structurally suspect. Heavy volume on a price advance confirms that multi-billion-dollar funds are accumulating positions, creating genuine support for the new price level. Every price move is incomplete information without its corresponding volume context. A 2 percent rally on 40 percent of normal volume is a very different event from a 2 percent rally on 200 percent of normal volume.
Institutional vs Retail Trading Activity
Institutional flow routes through dark pools and carefully executed block trades to avoid front-running. Retail participation shows up as spikes in single-stock call option volume, elevated social media engagement on specific tickers, and concentrated trading in volatile, low-float names. The Smart Money Flow Index compares early-morning trading, driven by retail reaction to overnight news, against the final hour, dominated by institutional settlement and clearing desks, to identify the direction of professional capital.
What Volume Says About Market Strength
A market making consecutive new highs on declining volume is signalling buyer exhaustion. The same price level is being reached with less conviction each session, raising the probability of a sharp reversal. Conversely, a severe selloff that reverses sharply and closes near the session high on massive volume is one of the most reliable technical signals of an intermediate market bottom. Capitulation volume, when sellers are fully exhausted, historically marks the transition point between decline and recovery.
How Macro Factors Influence Today’s Stock Market
Inflation Expectations and Market Pricing
Higher expected inflation forces analysts to raise the discount rates applied to future cash flows in valuation models. As the discount rate rises, the present value of distant earnings falls, compressing price-to-earnings multiples across growth-oriented sectors. The 5-year and 10-year breakeven inflation rates, derived from Treasury Inflation-Protected Securities pricing, tell professional investors whether the bond market believes the Federal Reserve is winning or losing its structural inflation battle.
Interest Rates and Bond Yield Impact on Equities
When the 10-year Treasury yield rises meaningfully, it creates a genuine competing asset class at the risk-free level. A 5 percent yield available on government-backed paper pulls capital out of equities by offering institutional investors a return previously only accessible by accepting full equity risk. Rising Treasury yields are compressing equity valuations across the board as the era of There Is No Alternative to stocks definitively closes, fundamentally reordering the risk-reward calculus for portfolio construction.
Currency Strength and Global Capital Flows
A strong US Dollar compresses the converted offshore revenues of American multinationals. A company generating 40 percent of revenue in Europe that reports in dollars sees those earnings automatically diminished when the dollar strengthens against the euro. Simultaneously, dollar strength draws international capital into US assets, providing a counterbalancing support bid for Treasuries and large-cap equities that partially offsets the valuation compression from rising yields.
Oil Prices and Commodity Market Influence
Crude oil above $90 per barrel simultaneously acts as an inflation input, raising transportation and manufacturing costs, and a performance driver for the energy sector. The petro-inflation feedback loop is self-reinforcing: high oil sustains inflation, which keeps rates elevated, which compresses bond prices and high-multiple equities, while energy stocks outperform. Materials and energy rotate upward in that environment; consumer discretionary stocks absorb the downward pressure from margin compression.
Market Psychology: Why Investors React the Way They Do
Fear vs Greed in Daily Trading
Behavioural economics establishes that investors register the pain of a loss at roughly twice the intensity of an equivalent gain. That asymmetry produces irrational selling into declines and irrational buying into rallies, both at structurally wrong moments. At the extremes, fear pushes prices below fundamental value and greed inflates them above it, creating the mispricing opportunities that disciplined institutional investors systematically exploit by acting counter to the prevailing sentiment.
Algorithmic Trading and Speed of Reactions
High-frequency trading systems execute in microseconds, reacting to news feeds faster than human reading speed. Natural Language Processing algorithms scan headlines for trigger words and execute institutional sell orders before a retail investor has finished reading the opening sentence of the article. The practical implication is that by the time a retail participant processes a market-moving headline and decides to act, the algorithmic response is already complete, prices have moved, and the opportunity or risk has passed.
How Headlines Amplify Volatility
Sensationalised financial reporting triggers retail selling; retail selling drives index prices lower; lower prices generate more frightening headlines. The feedback loop is self-contained and frequently produces moves outsized relative to the underlying economic catalyst. A 1.5 percent intraday decline described as a “meltdown” generates a behavioural response disproportionate to its actual structural significance, converting normal market volatility into a self-fulfilling acceleration of the move.
Common Mistakes Investors Make When Reading Market News
Reacting to Headlines Without Context
Selling a stock because earnings declined, without checking whether the decline was less severe than analyst consensus, causes investors to exit positions precisely as institutional buyers enter post-earnings relief rallies. The relevant data point is not whether performance was good in absolute terms but whether it deviated from what the market had already priced into the stock. Consensus expectation is the baseline, not absolute performance.
Confusing Short-Term Noise with Long-Term Trends
A 3 percent single-day decline on an index that has compounded at 10 percent annually for three decades is statistical noise, not an event requiring a portfolio response. Misinterpreting short-covering bounces within structural bear markets as the start of new bull runs has historically produced the most expensive individual investor mistakes, as retail capital floods back in at local peaks created by mechanical short-covering rather than fundamental improvement.
Ignoring Broader Market Structure
Purchasing a broad S&P 500 index fund under the assumption of wide diversification, while unaware that roughly 30 percent of that exposure concentrates in a handful of technology mega-caps, is not diversification. It is a concentrated technology bet with broad-index labelling. Structural concentration risk in modern passive index investing is one of the most systematically underappreciated features of the current market environment.
How to Interpret Stock Market Today Like a Professional
5-Step Market Reading Framework
Step 1: Check Index Context First
The opening question is not “what happened?” but “what did all three major indexes do relative to each other?” Divergence between the Nasdaq, S&P 500, and Dow reveals the direction of institutional rotation. The VIX reading confirms whether the day’s move carries genuine fear premium or reflects a calm, low-conviction session with thin volume and limited institutional participation.
Step 2: Identify Key Catalysts
Review the economic data calendar: did CPI, Non-Farm Payrolls, or GDP print at 8:30 AM EST? Did a Federal Reserve governor deliver a policy speech? Is a mega-cap reporting earnings after the close? These are the first-order inputs that institutional desks trade before constructing any narrative. The catalyst audit takes two minutes and replaces an hour of financial television commentary.
Step 3: Analyse Sector Performance
A daily sector heatmap reveals which areas attracted institutional capital and which experienced distribution. If utilities and consumer staples lead a nominally green session, professional money is hiding in defensive equities despite the positive headline index number. That tells more about true risk appetite than the S&P 500 closing price.
Step 4: Confirm with Volume and Market Breadth
Cross-reference the index move against its 30-day average daily volume. Check the Advance-Decline line to determine whether breadth confirmed the direction or contradicted it. If the S&P 500 rose 1 percent but decliners outnumbered advancers by a significant margin, the rally is narrow and structurally fragile, likely driven by a handful of mega-cap names rather than broad institutional buying.
Step 5: Filter Noise from Signal
Apply the “So what?” test to every piece of market news. Ask whether the event changes the underlying earnings power of the relevant companies or the structural macro regime 12 months forward. If the answer is no, it is noise. The vast majority of daily market news does not pass this test. The discipline to classify something as noise and take no action is itself a form of professional market skill.
Market Breadth and Internal Strength Indicators
Advancers vs Decliners Ratio
The Advance-Decline ratio tracks how many individual stocks finished positive versus negative on a given day. A healthy bull market typically features advancers outpacing decliners by a ratio of 2:1 or better. When the index closes positive but decliners outnumber advancers, professional desks recognise it as a warning that institutional buying is concentrated in a handful of names rather than distributed across the market’s full breadth.
New Highs vs New Lows
The daily count of stocks making 52-week highs versus 52-week lows acts as a leading indicator for trend durability. In a genuine uptrend, net new highs should expand alongside the rising index price. When the S&P 500 approaches historical resistance while the number of stocks simultaneously making 52-week lows is rising, the index is being carried by a diminishing number of participants. Every major market rollover in recent decades was preceded by weeks of exactly that configuration.
Why Strong Indexes Can Hide Weak Markets
Passive index fund flows automatically concentrate capital into the largest stocks by market weight with every dollar of new inflow. If three or four mega-cap names hold their prices on institutional safety buying, the index remains green while the other 490 constituents experience a stealth decline. The headline index number becomes a performance illusion that active stock pickers discover only after examining position-level returns rather than the ETF price on the screen.
What Today’s Market Activity Means for Investors
Short-Term Traders vs Long-Term Investors
Daily volatility is raw material for traders: it provides liquid ranges, options premium expansion, and directional momentum to exploit. For structural investors, the same volatility is irrelevant noise. The two groups are operating on entirely different time horizons and extracting entirely different information from the same price data. Confusing the two frameworks, applying a trader’s reaction speed to a long-term position, is the root cause of most retail investor underperformance.
When to Ignore Daily Market Noise
If a company’s long-term competitive position, management quality, and balance sheet strength remain intact, a stock price decline driven by broad market selling rather than company-specific deterioration requires no portfolio response. The correct review question is not “what is the price today?” but “has the original investment thesis changed?” If the thesis holds, the noise has no informational content and acting on it is a mistake with a transaction cost attached.
Conclusion: Reading the Market Without Panic
What Today’s Market Structure Requires
In mid-2026, persistent inflation and a restrictive Federal Reserve have created an environment where index headline moves mask more than they reveal. The top 30 percent of index weight sitting in a handful of mega-cap technology stocks means that “the market went up today” is frequently an incomplete, and sometimes actively misleading, description of what actually happened to the other 70 percent of the index. Professional reading of the market requires five layers of verification before any conclusion is reached.
How to Build a Rational News-Driven Strategy
Establish a morning data routine anchored to the economic calendar, bond yields, and commodity prices rather than television commentary. Document the thesis for each position in writing. When a sensational headline breaks, read the original thesis before making any adjustment. The written investment logic is one of the few structural defences against the psychological pressure of real-time noise, because it forces a comparison between the original reasoning and the current event rather than an emotional reaction to the event in isolation.
Final Rule: Context Always Beats Headlines
Market Signal Reliability: What Actually Matters
High signal
High signal
High signal
Medium signal
Low signal
No signal
A headline stripped of volume context, sector breadth, and macro positioning is not market analysis. It is a caption. The professionals who build sustained returns in volatile markets are not those who react faster to news; they are those who react less, with better frameworks. The daily noise is simply the admission fee for participating. The signal is what survives the filter, and almost none of what generates the loudest headlines qualifies.