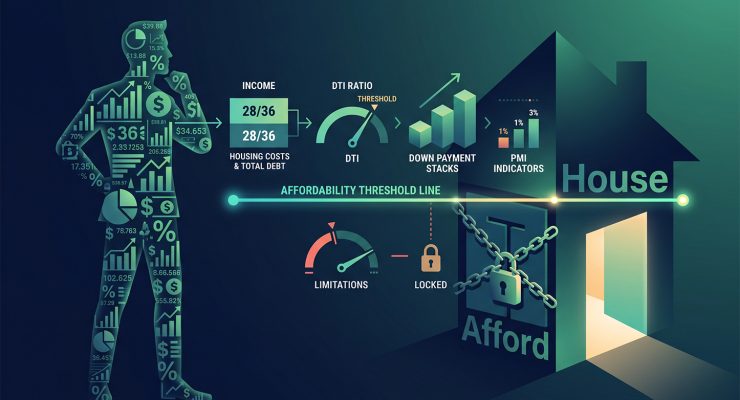
Working out how much house you can afford starts with separating two figures that sound alike but rarely match. A lender will calculate the largest mortgage payment your gross income can technically support. It will not ask whether that payment leaves room for child care, a retirement contribution, the weekly shop, or the holiday a family has taken every summer for a decade. Qualifying for a $3,500 monthly payment is a fact about a spreadsheet. Living with that payment for the next thirty years is a fact about a life.
Lenders have their own reasons to round the number up. Loan officers are commonly paid on commission, which rewards approving the largest mortgage a borrower can legally carry, not the one that suits their life. Once the loan closes, much of the risk moves on with it: automated underwriting clears the file, and Fannie Mae or Freddie Mac often buy the loan within months, leaving the original lender with little stake in what happens if the borrower struggles in year four.
That habit collides with a market offering buyers no slack. A closer look at how the US housing market has stalled this year helps explain why every income bracket feels squeezed at once: prices have stayed stubbornly high while mortgage rates sit on a plateau well above the norms of the previous decade. Properties once sold as starter homes now demand incomes that, only a few years ago, would have bought a larger property in a better postcode. Plenty of buyers are stretching to the very edge of what a lender will allow and mistaking that edge for a plan.
The 28/36 rule, and the debt filter that decides the rest
The oldest rule of thumb in mortgage lending caps housing costs at 28% of gross monthly income, a figure known as the front-end ratio. It is meant to cover the full PITI bundle: principal, interest, property taxes and homeowners insurance, along with mortgage insurance or association fees where they apply. A second number, the back-end ratio, folds in every other recurring debt, car payments, student loans, minimum card payments, and caps the combined total at 36% of gross income.
Lenders lean on a closely related figure called the debt-to-income ratio, or DTI, which simply restates those caps as a lending filter. Conventional loans generally top out at a back-end DTI of 43% to 45%. FHA loans and some non-conforming products will stretch to 50%, occasionally 56%, for borrowers with strong credit and healthy reserves, though anyone approved at that level is carrying meaningfully more risk than the average buyer.
Existing debt does more damage to a housing budget than most buyers expect. Roughly every $100 of monthly debt obligation erases $10,000 to $12,000 of total home-purchasing power at 2026 interest rates, which means a $500 car payment alone can shrink a maximum purchase price by more than $50,000. Clearing a card balance or finishing off a car loan before applying for a mortgage often opens up more room than another year spent saving for a down payment.
The ratios that decide your mortgage
In the country’s most expensive metro areas, the 28/36 split does not survive contact with reality. Buyers in cities such as San Francisco or New York routinely push their front-end ratio past 40%, a compromise that forces cuts everywhere else in the budget. The more honest fix, in a year when groceries, utilities and healthcare all cost more than they did, is to measure the ratio against take-home pay rather than gross income; doing so rebuilds the cushion the original rule assumed away.
What a mortgage payment actually contains
Principal and interest form the part of the bill most buyers picture, and in 2026’s higher-rate environment, the bulk of every early payment still goes toward interest rather than equity. Everything layered on top of that core figure is where budgets quietly come apart.
Property taxes climb as assessors catch up with inflated sale prices, often within twelve to twenty-four months of a purchase, which is the moment many new owners discover an unwelcome surprise sitting in their escrow account. Homeowners insurance has moved in a similar direction from the other side: climate-related losses and rebuilding costs have pushed premiums up by double digits in many states, and the line item now claims a far larger share of the monthly PITI total than it did even five years ago.
Two further costs rarely make it onto a buyer’s mental ledger. Association fees, where they apply, run anywhere from $50 to more than $1,000 a month, and lenders count every dollar of an HOA fee directly against borrowing capacity. Maintenance is the other blind spot: the standard guidance is to set aside 1% to 2% of a home’s value each year, $5,000 to $10,000 annually on a $500,000 property, and labour and material costs for ordinary repairs remain expensive enough in 2026 that the low end of that range rarely covers what actually breaks.
The table below sets out where a typical monthly payment actually goes once every layer is included.
| Component | Typical monthly range | Why it is rising in 2026 |
|---|---|---|
| Principal and interest | $1,800 to $2,200 | Higher rates mean more of each payment covers interest |
| Property taxes | $250 to $500 | Reassessments catch up with inflated sale prices |
| Homeowners insurance | $150 to $400 | Climate-linked losses are pushing premiums up nationwide |
| PMI, if under 20% down | $100 to $300 | Required until loan-to-value reaches 78 to 80% |
| HOA or association fees | $50 to $1,000 | Counted in full against borrowing capacity |
| Maintenance reserve | $400 to $800 | Labour and material costs remain inflated |
None of that accounts for the day something fails outright. New owners need a dedicated house-repair fund, separate from their general emergency savings, holding at least $5,000 to $10,000 from the day they collect the keys. A dead water heater or a failed furnace does not wait for a more convenient month.
The down payment decision: how much to put down, and how much to keep
How much cash goes down at closing changes almost everything that follows. Putting down 3% to 5%, the minimum on most conventional and FHA loans, produces the highest possible monthly payment and adds costly private mortgage insurance on top of it. Ten percent trims that payment meaningfully, lightens the PMI rate, and still leaves cash sitting in the bank. Twenty percent remains the benchmark for a reason: it removes PMI altogether, locks in the lowest achievable payment, and builds in equity that cushions against a fall in prices.
PMI itself typically costs 0.3% to 1.5% of the loan balance each year; on a $400,000 loan with average credit, that adds roughly $100 to $300 to the monthly bill. On a conventional loan it disappears once the loan-to-value ratio falls to 78% or 80%, usually after five to eleven years of paydown or appreciation, and a fresh appraisal after a run-up in local prices can sometimes end it sooner. On an FHA loan taken with a minimum down payment, the equivalent charge can last for the life of the loan unless the borrower refinances out of it.
None of which makes twenty percent the automatic right answer. Emptying a savings account to clear that threshold can leave a household house-poor, technically a homeowner, practically without a cushion for the next emergency or change in circumstances. Putting down 10% and keeping a real cash reserve is, for plenty of buyers, the safer trade than draining every account to dodge a monthly insurance charge that, set against five years of preserved liquidity, may turn out to be the cheaper option in the end.
What five incomes can actually buy in 2026
Translating all of this into how much house you can afford means running the numbers at a realistic rate, 6.5%, with 10% down and average taxes and insurance, and watching the gap between income brackets turn stark. A household earning $50,000 a year tops out near $130,000 to $150,000, a budget that points toward rural areas, small condominiums or down-payment assistance programmes rather than anything resembling a typical suburb. At $75,000, that ceiling rises to roughly $210,000 to $240,000, enough for a starter home or townhouse in a mid-sized Midwestern or Southern market but nowhere near a coastal metro.
A $100,000 income, often described as comfortable, buys a maximum of about $300,000 to $330,000, which sits close to the baseline price of an ordinary single-family home across much of the country; buyers at that level should expect competition rather than an easy run. At $125,000, the range opens to roughly $390,000 to $420,000, enough for a strong suburban neighbourhood, though property taxes and insurance can turn that budget aggressive quickly if any other debt remains on the books. A household earning $150,000 reaches $480,000 to $520,000, real leverage in most of the country, and still a careful budget in a coastal tier-one metro.
How far five incomes stretch at a 6.5% rate, 10% down
Estimated maximum comfortable purchase price by household income, assuming a 6.5% rate, 10% down and average taxes and insurance.
The reason the climb feels so steep is captured in a single ratio: median home price divided by median household income. A healthy market has historically traded at three to four times income. The national figure now sits closer to five or six times, and tops ten in the most expensive coastal cities, a shift that explains why households earning what would once have counted as a strong income still feel locked out.
Ten cities, ten different price tags
National averages flatten enormous differences between cities, and nowhere does that show up more starkly than in the income a household needs simply to compete. The table below lines up ten major metro areas against the price tags and incomes that 2026 buyers are actually facing.
| Metro | Median price | Income needed | Realistic budget range |
|---|---|---|---|
| New York | $780,000 | $210,000+ | $720,000 to $850,000 |
| Los Angeles | $900,000 | $240,000+ | $850,000 to $1,000,000+ |
| San Francisco | $1,200,000 | $310,000+ | $1,100,000 to $1,350,000 |
| Miami | $560,000 | $165,000+ | $520,000 to $600,000 |
| Chicago | $350,000 | $110,000+ | $320,000 to $380,000 |
| Dallas-Fort Worth | $410,000 | $115,000+ | $380,000 to $440,000 |
| Atlanta | $400,000 | $105,000+ | $370,000 to $430,000 |
| Phoenix | $440,000 | $115,000+ | $410,000 to $470,000 |
| Seattle | $820,000 | $215,000+ | $760,000 to $880,000 |
| Austin | $460,000 | $125,000+ | $430,000 to $500,000 |
Two patterns stand out. Coastal hubs such as San Francisco, Los Angeles, Seattle and New York demand household incomes north of $200,000 simply to clear the entry threshold, a bar that excludes the overwhelming majority of American earners outright. Inland metros such as Chicago, Atlanta, Phoenix and Dallas-Fort Worth sit in a different world, where six-figure incomes at the lower end of that range can still buy a conventional family home, even if local quirks, Illinois property taxes in one case, Florida insurance premiums in another, can move the real number considerably.
The hidden costs, and the stress test that catches them first
Four costs break more home budgets than any single rate increase. The first is the property tax reassessment that typically lands twelve to twenty-four months after closing, once the county catches up with the new sale price and the buyer’s escrow payment jumps without warning. The second is the insurance spike: carriers in Florida, California and Texas have raised premiums by double digits or withdrawn from entire markets altogether, leaving new owners to absorb whatever replacement coverage costs. The third is maintenance inflation, with routine jobs such as replacing a water heater or repairing a deck now running 30% to 50% above older baselines because of persistent shortages in skilled labour and materials. The fourth is the renovation trap: buyers who empty their accounts to close on a house often have nothing left to fix the dated bathroom or furnish the spare room, and reach for high-interest debt to do it.
The way to find out whether a budget can absorb all four is to test it before signing anything.
Stress-testing a home budget in four steps
Save the rent-to-mortgage gap every month for six months and watch what it does to ordinary spending
Model a rate that is 1 to 2 percentage points higher if buying new construction or using an adjustable loan
Simulate a 20% income drop and check whether reserves can cover the base mortgage payment for six months
Confirm that three to six months of full living costs sit in savings, separate from the down payment itself
The first step costs nothing and reveals the most. A household that can run that rent-to-mortgage experiment without strain has found a real answer; one that cannot has found it even faster, and for free.
A simple formula for knowing how much house you can afford
The right move depends heavily on where a household already stands. A back-end DTI under 30% suggests genuine room to manoeuvre, comfortable enough to absorb a rate shock or a surprise repair without real strain. Thin savings argue for waiting and building a larger cushion rather than stretching to the legal limit on 3% down with nothing left over. Anyone counting on a future bonus, a promotion or extra commission should budget against today’s guaranteed salary instead, since a mortgage application does not accept promises as collateral. High-interest debt is worth clearing before applying at all, since doing so cleans up the DTI calculation and can open meaningfully more borrowing room than another year of saving would. Buyers in the most expensive metros may be better served by renting longer and building a larger down payment than by buying a smaller, costlier compromise just to say they own something; matching a budgeting method to how income actually behaves, a question explored at length in a comparison of budgeting approaches for irregular and steady earners alike, makes that calculation considerably easier to run.
Two ways of running the numbers sit at opposite ends of the spectrum.
Conservative budget vs aggressive budget
A workable middle path looks like this: take net monthly income, multiply by 0.35, and subtract whatever debt payments already exist. What remains is a defensible ceiling for principal, interest, taxes and insurance combined, a figure worth writing down before a single open house gets booked. Some signals are worth treating as a stop sign rather than a caution light: plans to relocate within three years, a back-end DTI already above 45%, fewer than three months of expenses held in reserve after closing, or a local rental market that costs noticeably less than buying the equivalent property. Any one of those should be enough to pause.
Qualification is an algorithm’s opinion of a household’s limits. Affordability is something only the household can judge, weighed against its own goals, its own debts and its own tolerance for a bad month. The home worth buying in 2026 is not the biggest one a lender will sign off on. It is the one that still leaves room to enjoy living in it.