The choice of how to pay for solar will determine more of the financial outcome than the hardware. Most homeowners spend weeks comparing panel brands and inverter specs. Almost none give equivalent time to solar financing options, which is where the larger decision actually lives. A $25,000 system bought outright can return $52,000 in net savings over 25 years. The same system on a 25-year lease can return as little as $14,000, with the solar company collecting the rest. Hardware efficiency moves the equation by 10 to 15 percent. Financing terms can shift it by 60 percent or more.
The federal Residential Clean Energy Credit returns 30 percent of the gross system cost to the legal owner, worth roughly $7,200 on a $24,000 installation. Lease and PPA customers never see it; the corporate financier takes it. That one variable, more than anything on a product sheet, often decides the total financial outcome.
Key Solar Financing Numbers at a Glance
Why Solar Financing Options Matter More Than Solar Equipment
The Biggest Factor Affecting Lifetime Solar Savings
Premium monocrystalline panels may produce 12 to 15 percent more electricity than standard alternatives over 25 years. A financing structure that hands the 30 percent credit to a third party while charging the homeowner a compounding escalator is a value transfer in a different league entirely. Hardware affects production. Financing determines who keeps the money that production generates.
How Financing Changes Your True Cost of Solar
A $25,000 system costs $17,500 net after the 30 percent credit, paid in cash. The same system through a specialty solar loan with a 15 percent dealer fee and a 7.49 percent APR over 20 years produces total payments exceeding $31,000. Through a lease with a 2.5 percent annual escalator starting at $110 per month, cumulative payments reach approximately $44,700 over 25 years. The hardware is identical in all three cases.
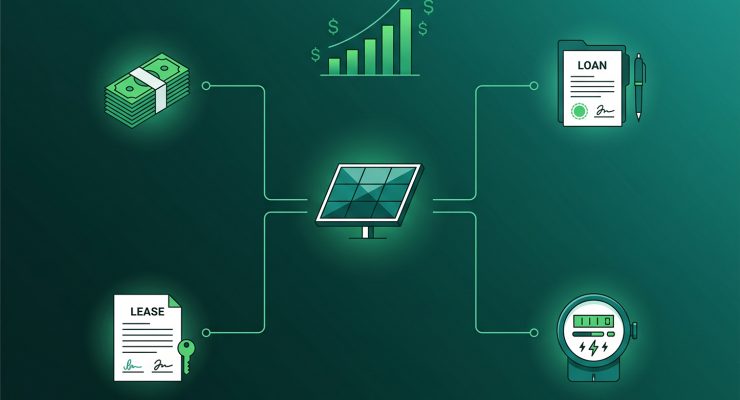
The Four Main Solar Financing Paths Homeowners Can Choose
Four structures cover virtually all residential solar transactions in the United States: cash purchase, solar loan, solar lease, and power purchase agreement. Cash delivers immediate ownership at the lowest long-term cost. A solar loan provides ownership via borrowed capital with fixed monthly payments. A lease transfers ownership to a third-party developer who charges a fixed monthly rental. A PPA also uses third-party ownership, but the homeowner pays per kilowatt-hour for what the panels produce rather than renting the hardware outright.
Understanding the Economics of a Residential Solar System
Upfront Cost vs Lifetime Cost
Upfront cost and lifetime cost are different figures. A lease or PPA shows zero upfront while committing the homeowner to cumulative payments that typically exceed $40,000 over 25 years. A cash purchase requires $16,000 to $25,000 upfront and nothing after. Comparing these options properly means putting all of them on a single timeline: total cost across the full system life.
Solar Payback Period Explained
The payback period counts the years before cumulative savings match the net system cost. For cash purchases it typically runs six to eight years. For loans, the effective payback stretches longer, since monthly payments eat into savings during the repayment period. For leases and PPAs there is no payback in any conventional sense; the homeowner never owns the asset and never reaches the point where the electricity is free.
How Electricity Rate Inflation Impacts Savings
US utility rates have risen at an average of 4 to 6 percent per year over the past decade. For a homeowner who owns their system, every rate increase directly widens the savings. For a lease customer on a 2.5 percent annual escalator, the savings margin narrows whenever utility inflation falls below that figure and disappears if rates stagnate or fall.
Key Numbers to Compare Before Choosing Financing
Three metrics allow a proper comparison. The Levelised Cost of Energy (LCOE) divides total net system cost by total kilowatt-hours produced over 25 years, giving a cost-per-kWh that sits directly against the local utility rate. Net present value (NPV) expresses the investment’s worth in today’s dollars. The internal rate of return (IRR) converts those cash flows into an annualised percentage comparable to other investments.
Cash Purchase Solar: Maximum Ownership and Long-Term Savings
How Cash Solar Purchases Work
Cash purchases follow a milestone payment structure. The homeowner pays the installer in stages tied to signing, equipment delivery, installation, and final inspection. Title passes at interconnection, when the utility activates bi-directional metering. The full process from signed contract to first power typically takes two to four months; a detailed breakdown of each stage is available at the real solar installation timeline.
Typical Payback Period and Lifetime ROI
On a net $16,800 system (after the 30 percent credit on a $24,000 gross installation), the payback period averages six to eight years at median US utility rates. The remaining 17 to 22 years of the warranty period produce electricity at no marginal cost. Total 25-year net savings, accounting for panel degradation of roughly 0.5 percent annually, run between $30,000 and $70,000 depending on local rates, system size, and sunlight.
Advantages and Drawbacks of Paying Cash
Paying cash removes interest, dealer fees, and escalators from the equation entirely. It maximises lifetime savings, keeps every federal and state incentive inside the household, and makes future home sales straightforward. The real constraint is capital: $17,000 to $25,000 in liquid funds, and committing that amount means forgoing whatever those same dollars could earn in equities over the same 25 years. Whether solar beats the alternative depends on local utility rates and the homeowner’s next-best option.
Solar Loans: Ownership With Lower Upfront Costs
25-Year Net Savings by Financing Type
$52,000
$28,000
$14,000
$11,500
Based on a representative 8 kW system, $24,000 gross price, local utility rate $0.18/kWh rising at 4% annually.
How Solar Loans Work and What They Cost
Solar loans work like any secured or unsecured consumer loan: the lender pays the installer, and the homeowner repays principal plus interest over a set term. Ownership, and the 30 percent tax credit, stays with the homeowner. In 2026, prime-credit borrowers can expect APRs between 6.99 and 9.99 percent on standard specialty solar loans, with 10, 15, 20, or 25-year terms available.
Secured vs Unsecured Solar Loans
HELOCs use the property as collateral and carry lower interest rates. Unsecured specialty solar loans use the equipment itself as collateral; they cost more in interest but leave home equity untouched. A HELOC default risks foreclosure. An unsecured solar loan default risks equipment repossession, which is a less severe outcome in practice.
The Hidden Dealer Fee Problem
The biggest hidden cost in solar loan transactions is the dealer fee, sometimes labelled an origination or platform fee. Solar lenders charge installers 10 to 30 percent of the project value to offer low-APR products. Installers recover that by inflating the cash price quoted to loan customers. A homeowner comparing a $24,000 cash quote against a $28,500 loan quote is not looking at different hardware; they are looking at the dealer fee folded into the principal. The effective APR on many solar loans runs well above the number advertised.
Solar Lease Agreements: Lower Entry Cost, Reduced Returns
How Solar Leasing Works
Under a solar lease, a developer installs equipment on the homeowner’s roof at no upfront cost, retains legal ownership, and charges a fixed monthly rental. Payments are set below the homeowner’s current utility bill to create day-one savings. The installer covers maintenance, guarantees a minimum production level, and handles replacements throughout the term, typically 20 to 25 years.
Escalator Clauses and Long-Term Cost Increases
The escalator clause is what most lease customers underestimate. Annual increases of 1.9 to 3.5 percent are standard. A $100 monthly payment on a 2.9 percent escalator becomes $103 in year two, $134 by year 10, and $206 by year 25. The savings margin, the gap between the lease payment and what the utility would have charged, shrinks whenever the escalator outpaces utility inflation. In markets where grid power has got cheaper through renewable buildout or policy change, that margin can flip entirely.
Pros and Cons of Solar Leasing
Leasing requires no money down and no maintenance. The day-one monthly savings are real. What the homeowner does not get: the 30 percent federal tax credit, any equity, or a clean title when it comes time to sell. A buyer must either qualify to assume the lease or the seller buys out the remainder. Total 25-year savings under a typical lease run around $14,000, roughly 27 percent of what a cash purchase returns on the same roof.
Solar PPA: Paying for Energy Instead of Equipment
How a Solar PPA Works
A PPA works on the same ownership structure as a lease but prices things differently. Instead of a fixed monthly rental, the homeowner pays a set rate per kilowatt-hour for what the panels actually produce. A PPA at $0.13 per kWh against a utility rate of $0.22 creates real day-one savings. The provider owns and maintains the equipment; the homeowner gets a monthly bill based on metered output.
Fixed vs Escalating PPA Pricing
Fixed PPAs hold the per-kWh rate steady for the contract term. Escalating PPAs increase it annually, typically by 2 to 3 percent, on the assumption that utility rates will keep rising faster. A fixed PPA at $0.14 per kWh is a good deal if utility rates hit $0.30 by year 20; it is a poor one if a state adds renewable capacity and retail prices stay flat. Escalating PPAs make the downside of that scenario worse.
Benefits and Limitations of Solar PPAs
PPAs carry no upfront cost and no maintenance obligation. Monthly bills track actual production, so the homeowner pays less in a cloudy month. What they give up is ownership: no tax credit, no equity, nothing added to the property. Net 25-year savings on a typical escalating PPA starting at $0.13 per kWh with a 2.9 percent annual escalator come to roughly $11,500, the weakest result of the four.
Solar Ownership vs Lease: The Financial Differences That Matter
Who Owns the System, Who Receives the Tax Credits, and What Happens to Property Value
Ownership drives every downstream financial difference. A cash or loan buyer holds title to the solar asset, claims the 30 percent ITC on their federal return, and captures the 4.1 percent home value premium that research from Lawrence Berkeley National Laboratory associates with owned systems. A lease or PPA customer holds none of this. The developer claims both the ITC and MACRS accelerated depreciation, writing down the asset over five years for tax purposes, while the homeowner receives no equivalent benefit.
Selling a Home With Each Financing Option
Owned systems transfer as part of a standard property transaction. A lease or PPA ties up the title. The buyer must pass the financing company’s credit check and assume the contract, or the seller pays out the remaining stream of payments, typically valued at net present value. Discovering this mid-sale rather than before signing has become a familiar story in high-solar markets.
Solar Loan vs Lease vs PPA vs Cash: Side-by-Side Comparison
The table below compares the four solar financing options across the metrics that matter most for long-term household financial outcomes.
| Criterion | Cash | Solar Loan | Solar Lease | PPA |
|---|---|---|---|---|
| Upfront Cost | $16,800 net | $0 down | $0 down | $0 down |
| System Ownership | Homeowner | Homeowner | Developer | Developer |
| 30% Federal ITC | Homeowner | Homeowner | Developer | Developer |
| Monthly Payment | $0 | Fixed (principal + interest) | Fixed + annual escalator | Variable per kWh produced |
| Avg Payback Period | 6-8 years | 10-12 years | None | None |
| Home Value Increase | +4.1% | +4.1% | None | None |
| 25-Year Net Savings | ~$52,000 | ~$28,000 | ~$14,000 | ~$11,500 |
Real-World Example: Which Financing Option Creates the Highest Savings?
A Single 8 kW System Across Four Scenarios
To compare all four options on a single system: an 8 kW installation, $24,000 gross, expected first-year output approximately 11,000 kWh. Local utility rate is $0.18 per kWh, rising 4 percent annually. Owners receive the 30 percent credit ($7,200). After 25 years the system runs at around 88 percent of original output, accounting for standard panel degradation.
The table below ranks each financing path by total 25-year net savings.
| Financing Type | Net System Cost | 25-Year Net Savings | Rank |
|---|---|---|---|
| Cash Purchase | $16,800 | ~$52,000 | 1st |
| Solar Loan | ~$31,000 | ~$28,000 | 2nd |
| Solar Lease | ~$44,700 | ~$14,000 | 3rd |
| Solar PPA | ~$43,000 | ~$11,500 | 4th |
A $40,500 gap separates the best and worst 25-year outcomes on the same physical equipment. The panels contribute nothing to that gap.
Hidden Costs and Contract Terms Homeowners Often Miss
Dealer Fees on Solar Loans
Dealer fees get buried in the cash price to make the advertised rate look competitive. An installer quoting $28,500 to a loan customer and $24,000 to a cash buyer is embedding a $4,500 fee (roughly 18.75 percent) into the loan principal. A homeowner who applies the 30 percent credit ($8,550, calculated on the inflated $28,500) to the balance reduces the principal to $19,950; interest still accrues on the bloated original figure.
Lease Escalation Clauses
Escalator clauses grow faster than most people account for when they sign. A 2.9 percent annual increase on a $100 monthly payment reaches $151 by year 15 and $206 by year 25. The homeowner signed for $100 and is paying double in the final years, regardless of whether utility rates moved enough to justify it.
Early Termination Fees and System Transfer Requirements
Exiting a lease or PPA early is almost never cheap. The typical exit involves buying the system at a “fair market value” set by the financing company, or paying out the net present value of all remaining contracted payments. A buyer who declines to assume the contract during a home sale triggers the same bill for the seller.
Four Questions Before Signing Any Solar Agreement
How to Choose the Best Solar Financing Option
Decision Framework for Comparing Offers
Four questions cover most of what homeowners miss. Who claims the 30 percent tax credit, and what is the dollar amount on this specific system? Is there a dealer fee in the quoted price, and if so, what is the cash price without financing from the same installer? What is the exact annual escalator, and what does the monthly payment become in year 15 and year 25? What are the contract terms for transferring or exiting the agreement if the home is sold?
Best Option by Financial Profile
Cash wins on lifetime savings across every utility rate scenario. For ownership without draining liquid capital, a no-fee solar loan from a credit union or a HELOC is the rational alternative. A homeowner without enough federal tax liability to use the 30 percent ITC, or one who genuinely wants no maintenance exposure, can make a reasonable case for a lease or PPA, as long as the escalator rate runs below the expected trajectory of local utility inflation. Homeowners planning to sell within five years have the clearest reason to avoid leases and PPAs entirely, and possibly to avoid solar altogether unless the system can be fully paid off before the sale closes.
Conclusion: Which Solar Financing Option Is Financially Optimal for Most Homeowners?
Solar Payback Timeline: 25 Years by Financing Type
Why Cash Usually Produces the Highest ROI
Buying outright removes every financial intermediary. No lender takes interest. No leasing company captures the ITC. No escalator clause outpaces utility inflation. The homeowner keeps the full savings, builds equity in a real asset, and retains clean flexibility to sell or refinance without contract complications. The 30 percent credit returned the following spring typically cuts the net payback period by two to three years on its own.
When a Solar Loan Can Match Cash Economics
A solar loan can approach cash economics in one circumstance: when the homeowner applies the full 30 percent credit directly to the loan principal in year one. On a $24,000 system with a $7,200 credit at 6.99 percent APR, that payment reduces the effective obligation to $16,800 and shortens the loan term materially. Credit unions and community banks with clean, fee-transparent solar loans make this work. Specialty lenders who hide dealer fees in the principal make it much harder.
Situations Where Lease or PPA May Still Be the Right Choice
The case for a lease or PPA is narrower than the marketing suggests, but real. Homeowners with low federal tax liability get nothing from owning a system that generates a credit they cannot use; leasing simply forgoes an unavailable benefit. In markets where utility rates have consistently outrun the escalator rate, third-party customers still preserve a meaningful savings margin. For homeowners who want a predictable monthly bill, no equipment risk, and a guaranteed production floor, the tradeoff can be worth it even at a lower total return.
Final Checklist Before Signing Any Solar Financing Agreement
Before signing: confirm who claims the 30 percent credit; ask for the same-day cash price without financing and compare it to the loan price to surface any dealer fee; find the exact escalator percentage and run the monthly payment out to year 15 and year 25; read the transfer and early termination terms in full. The homeowner who does this consistently makes a better financial decision than one who compares only the first monthly figure. In solar financing, the number that costs the most is almost always the one not shown upfront.